The Efficiency Gap: Why Your Sample Size Calculation is Leaving 30% on the Table

The pharmaceutical industry is facing a cost disease. Bringing a new drug to market now routinely exceeds $2 billion, with patient recruitment standing as the single largest bottleneck.
In response, we usually reach for operational fixes: faster sites, simpler protocols, digital recruitment. But there is a mathematical lever that is often overlooked during the design phase—one that can cut recruitment needs by 20–40% without sacrificing statistical rigor.
In the tech industry, this idea is called CUPED (Controlled Experiment Using Pre-Experiment Data). In biostatistics, it’s simply ANCOVA. The analysis method is standard. The planning for it is not.
What actually drives this inefficiency is not disagreement about methods, but how we think about variability.
Noise vs. Signal
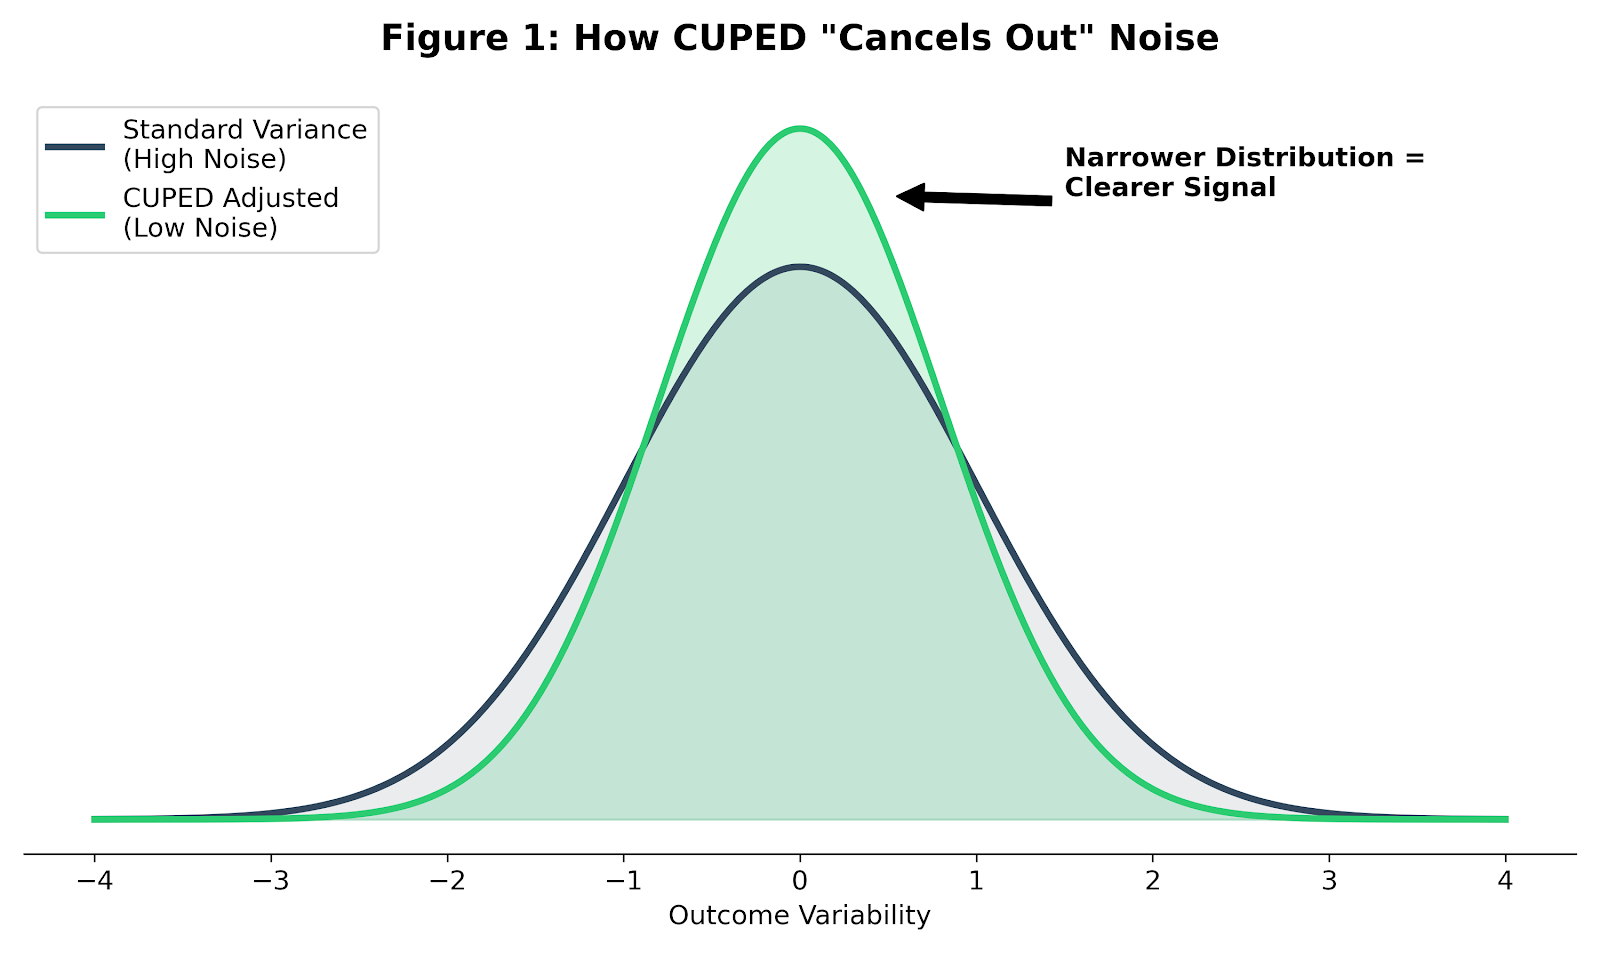
In any experiment—whether testing a website feature or a hypertension drug—you are trying to detect a signal (the treatment effect) in the presence of noise (random variation).
In clinical trials, that noise is large. Human outcomes vary widely, even under tight eligibility criteria. If you analyze only final outcomes, your statistical test has to fight through all of that natural variation. The only way to win is brute force: recruit more patients.
Once you see the problem as a variance problem, a second disconnect becomes obvious.
The Planning Gap
I’ve seen this disconnect in practice more times than I can count. The statistical analysis plan specifies ANCOVA; the sample size justification is based on a two-sample t-test. When I’ve asked why, the answer is usually simple: that’s what the calculator defaulted to.
Analysis (post-trial). We almost always use ANCOVA to adjust for baseline values, because we know it increases power.
Design (pre-trial). We often calculate sample size using simple two-sample t-test assumptions or change-from-baseline estimates, usually justified as being “conservative.”
This conservatism is expensive. By ignoring the variance reduction that ANCOVA provides during planning, we systematically inflate sample sizes and recruit patients we do not actually need.
This gap exists because not all adjustment strategies are created equal.
Why ANCOVA Wins
There are three common ways to analyze a continuous outcome like blood pressure:
- Post-Treatment Only: Ignores where the patient started. Lowest power.
- Change from Baseline (CFB): Subtracts baseline from the final outcome. This implicitly assumes the regression coefficient between baseline and outcome is exactly 1 ($\beta = 1$). When that assumption fails—as it usually does—CFB is inefficient.
- ANCOVA (CUPED): Estimates the relationship from the data and chooses the regression coefficient that minimizes variance.
As shown by Vickers & Altman (2001), ANCOVA is statistically superior to CFB in almost every randomized trial scenario.
The required sample size reduction is approximately proportional to the squared correlation ($\rho^2$) between baseline and outcome:
$$N_{adjusted} \approx N_{original} \times (1 - \rho^2)$$
Note: This approximation assumes a linear relationship and no measurement error in the baseline. If these assumptions hold:
- ρ = 0.5 → ∼25% sample size reduction.
- ρ = 0.7 → ∼49% sample size reduction.
A $4 Million Example
Consider a realistic Phase II hypertension trial.
Design assumptions
- Target effect: 5 mmHg reduction in systolic blood pressure
- Standard deviation: 15 mmHg
- Power: 80%
- Alpha: 0.05
The conservative approach
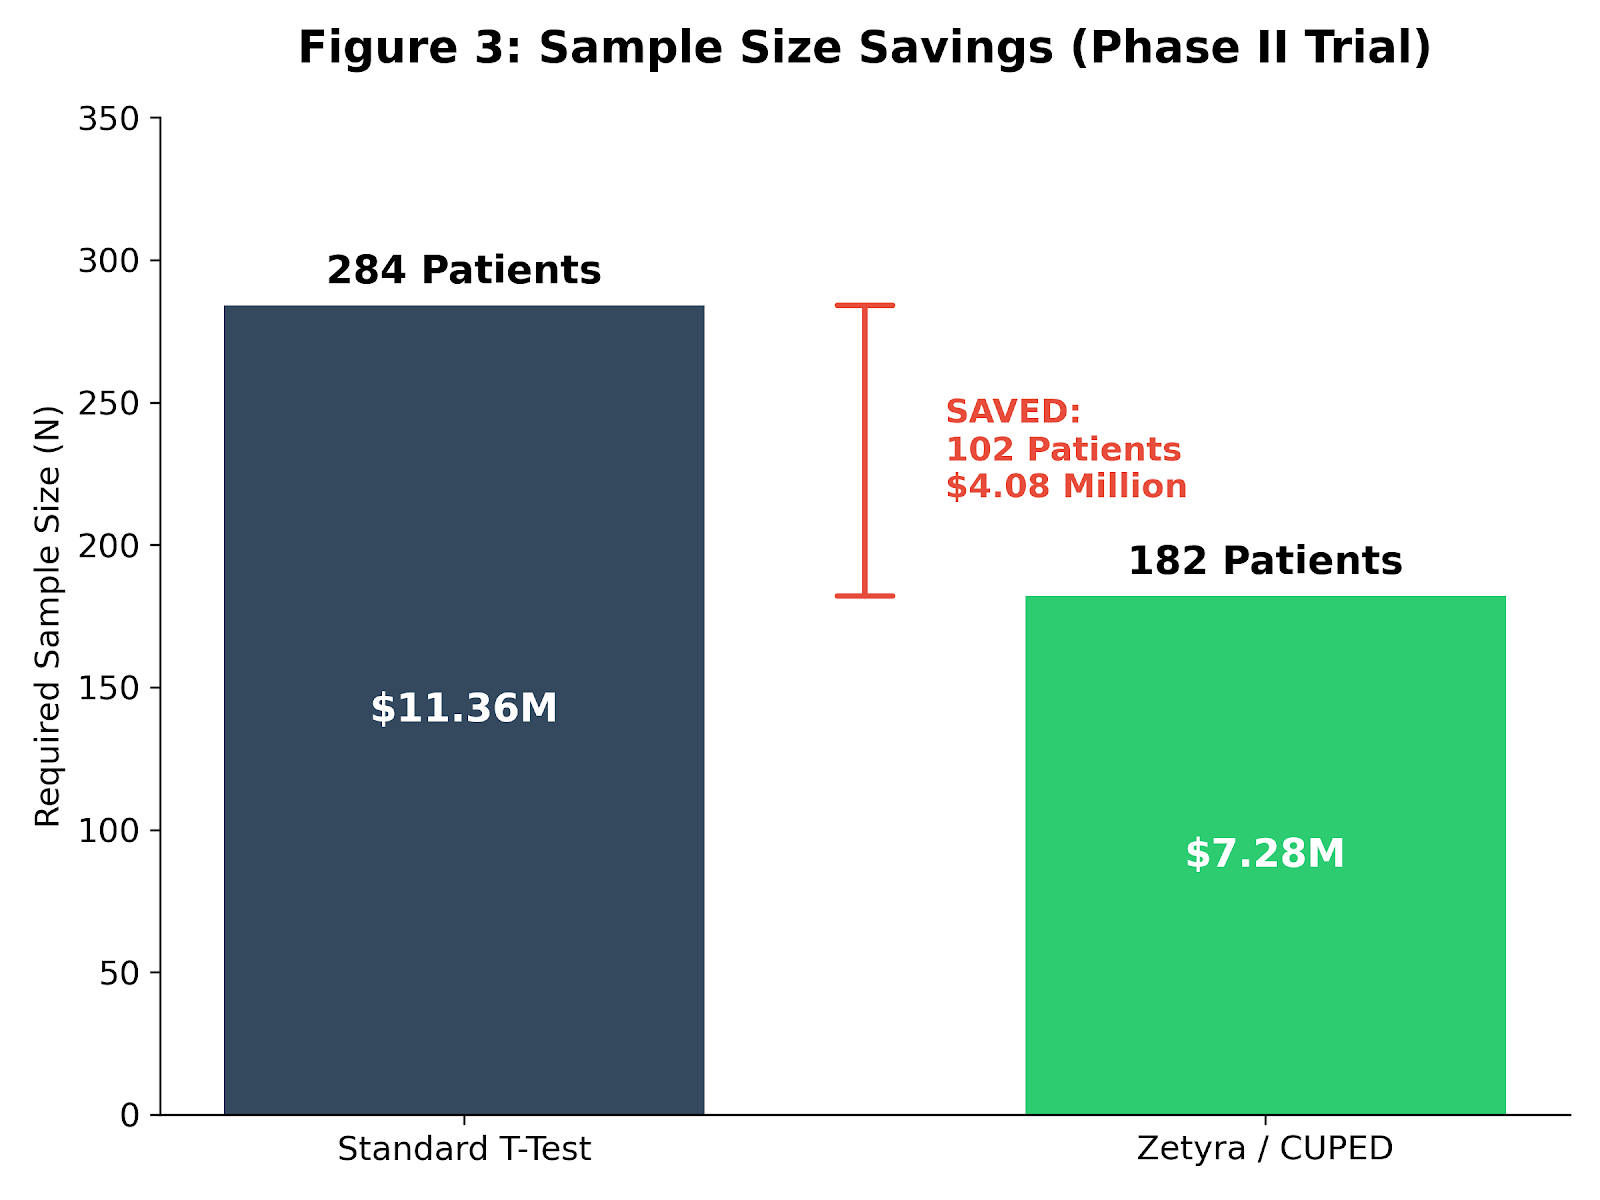
A standard difference‑in‑means calculation yields 284 patients (142 per arm).
At roughly $40,000 per patient—a typical Phase II burden—that is an $11.36 million trial.
The conservative approach
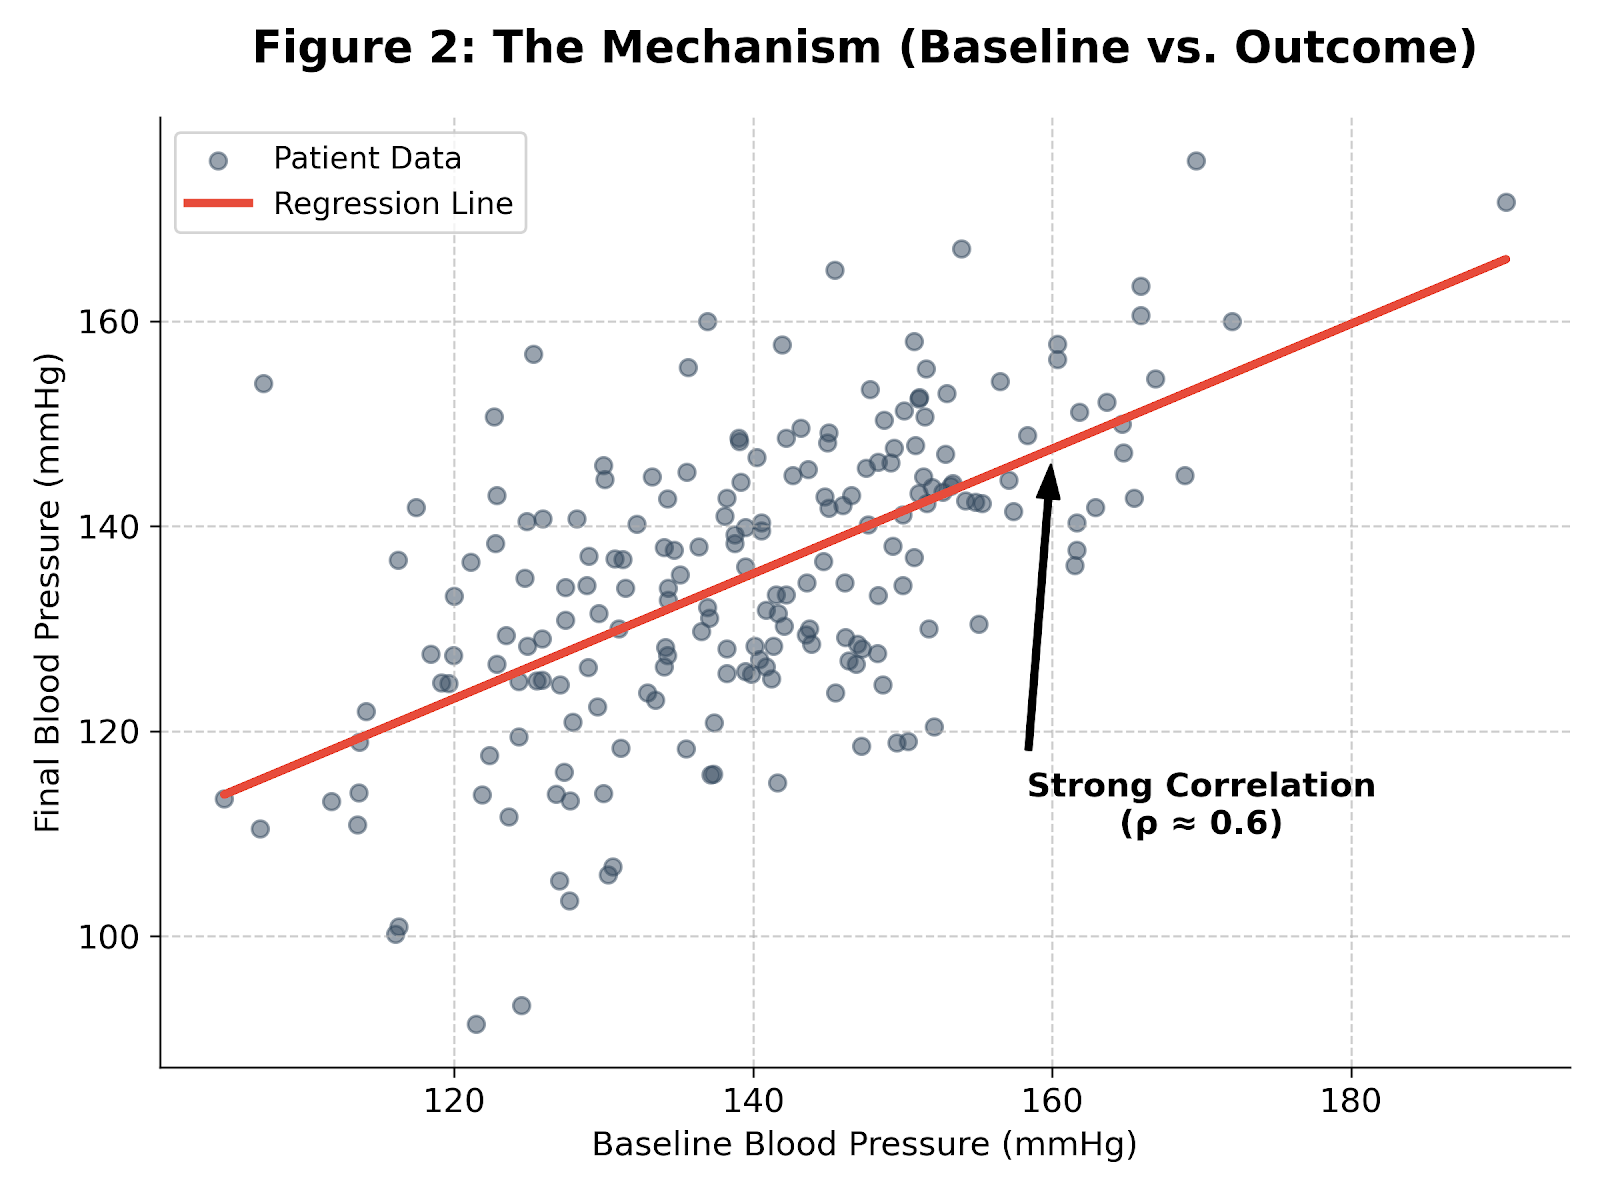
Baseline blood pressure is strongly correlated with the final measurement (ρ ≈ 0.6). Accounting for that variance reduction during planning:
285 × (1 - 0.36) = 182 patients
The result
- 102 fewer patients
- ~$4.1 million saved in direct trial costs
- Potentially 4–6 months shaved off recruitment
Given these stakes, it’s fair to ask why this inefficiency is still so common.
Why This Keeps Happening
The FDA’s 2023 guidance Adjusting for Covariates in Randomized Clinical Trials for Drugs and Biological Products explicitly encourages covariate adjustment. Yet bloated protocols persist.
Two forces drive the gap:
Tooling. Many legacy sample‑size calculators default to t‑tests or paired designs. Few ask for baseline‑outcome correlation. If the tool does not prompt for it, it rarely makes it into the plan.
Inertia. Over‑recruitment feels safe. Relying on a correlation can feel risky. But in today’s capital‑constrained environment, recruiting 100 unnecessary patients is an operational risk of its own.
The consequence of this planning gap is not subtle.
We do not always need new biological breakthroughs to run better trials. Sometimes we just need tighter statistical planning.
By accounting for baseline‑outcome correlation during design—not just analysis—we can run leaner, faster studies. This is not only about money. Every unnecessary patient enrolled is a patient exposed to experimental risk without adding scientific value.
Check your efficiency.
Unlike standard calculators that assume t‑test designs, the Zetyra ANCOVA calculator lets you plan directly around baseline‑outcome correlation and see exactly how much you are leaving on the table.
📬 Want more insights? Subscribe to the newsletter or explore the full archive of Evidence in the Wild for more deep dives into experimental design.
Member discussion